Vermont Energy Control Systems

Practical monitoring and control for the real world

Consolidated Dashboard

Consolidated Dashboard | Vermont Energy Control Systems

Vermont Energy Control Systems

Practical monitoring and control for the real world

Consolidated Dashboard

Introduction

The Vesta product line from Vermont Energy Control Systems LLC is an open-source monitoring, datalogging, and control solution. It is non-proprietary and easily interfaced to other sensors and equipment.

This case study describes the use of a Vesta controller to collect and display live data from a wide variety of other systems. This case study falls at the ‘very complicated’ end of the spectrum, but it shows the power of the open source tools provided with the Vesta controllers.

Problem

The homeowner has multiple heating, cooling, control and monitoring systems in his house, from multiple manufacturers. He also has some home-grown equipment that collect data from a variety of sources. He wanted to aggregate data from all of his systems in a single place so that he could see the interactions between systems and provide a central consolidated graphical dashboard. Systems in the house include the following:

  • Four-panel Solar hot water system with its own circulator controlled by a solar differential controller
  • Okofen bulk-fed pellet boiler controlled with Ranco thermostat
  • Propane boiler used as a backup heat source
  • Taco zone controllers controlling 8 circulator pumps
  • Large water storage tank used for thermal storage, with integrated indirect domestic hot water tank controlled with an aquastat
  • Davis Vantage Pro weather station
  • Nest thermostats controlling five hot water baseboard zones and two radiant zones
  • 48 Solar panels connected to four Outback Solar inverters, four Midnite Solar charge controllers, and sixteen flooded lead acid batteries which provide backup power in the event of a commercial power outage
  • Two Arduinos connected to a total of 26 one-wire temperature probes, a Raspberry Pi collecting weather from the Vantage Pro weather station, Nest data from the Nest API, status and performance data from the Okofen pellet boiler, Outback Solar production and consumption and the Midnite Solar charge controllers

Prior to installing the Vesta, the homeowner was using the Raspberry Pi and Arduinos to send data to a cloud-based database and graphing system (xively). This allowed him to see independent graphs of each monitored piece of equipment, temperature and data element, but did not provide any good way to see how each of the components interacted with each other.

Consolidated Dashboard | Vermont Energy Control Systems

Vermont Energy Control Systems

Practical monitoring and control for the real world

Consolidated Dashboard

Solution

The homeowner added a Vesta controller and an RI-024A relay input box to the system. The relay box allows the Vesta to monitor several devices:

  1. The Solar Hot Water circulator
  2. The Ranco thermostat that controls the Pellet Boiler
  3. The Propane Boiler
  4. The Domestic Hot Water tank aquastat

There are also two analog temperature sensors connected directly to the Vesta, measuring temperature at the top and bottom of the Water Storage Tank.

Taking advantage of the Vesta product line’s open source tools, he was able to quickly modify the Vesta’s network task to collect data from the Raspberry Pi, which in turn collects data from several other devices, including the two Arduinos, weather station, thermostats and solar equipment.

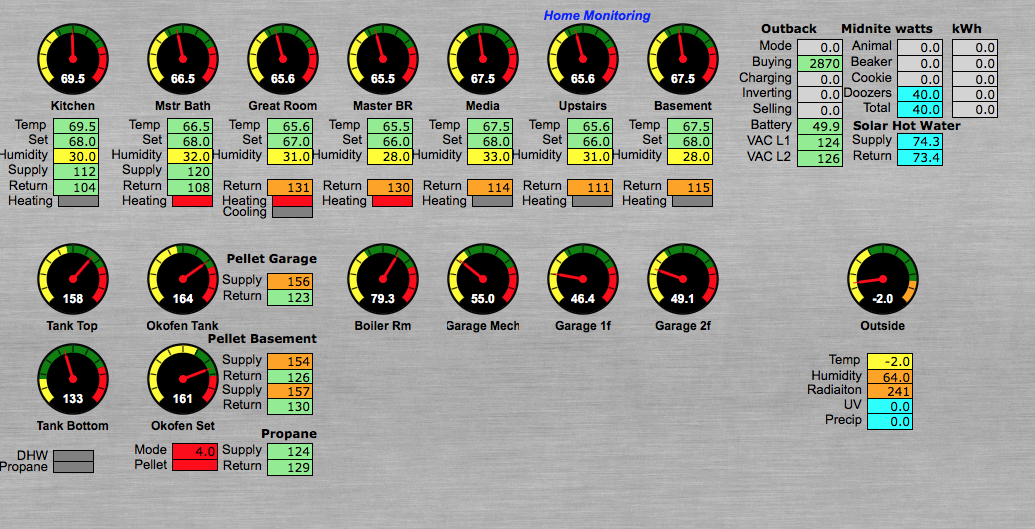
Using the tools provided with the Vesta, he built a web-based dashboard accessible from anywhere that provides a single real-time unified view into all of the elements of the environmental, heating and cooling and solar production at the house:

A screenshot of the user

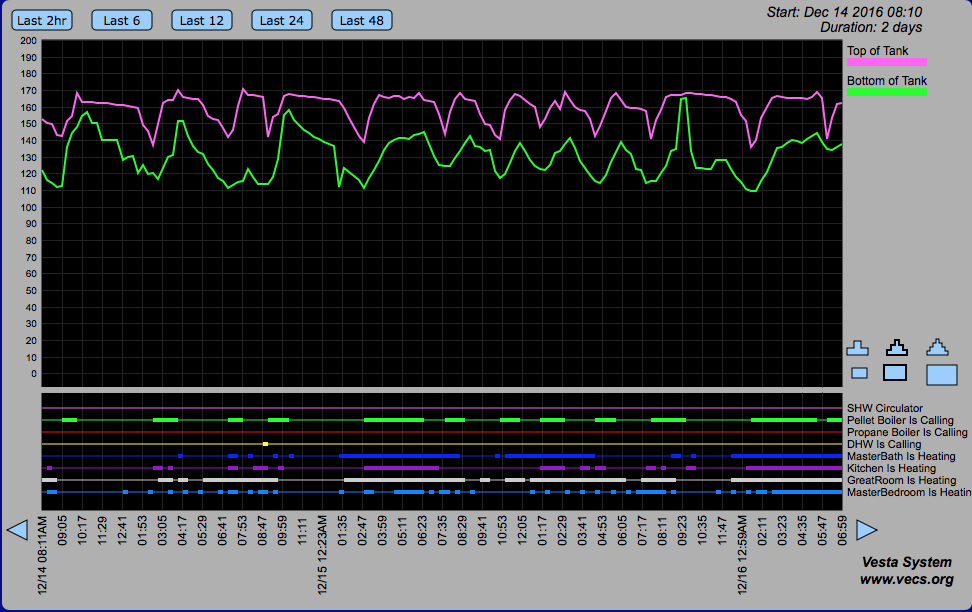
The Vesta also logs this data to internal storage so that it can be displayed using the built-in charting tool:

A screenshot of the chart with the user's data

At present, the Vesta is only providing monitoring and data collection services. However, it can easily take over control over previously independent subsystems if the data shows that there’s an opportunity to improve performance or efficiency.

For instance, the Vesta would be able to avoid firing the pellet boiler early in the morning if the forecast for the day calls for plenty of sunshine, as the solar hot water system and passive solar gain in the house would be able to provide the anticipated necessary heating.

Summary

Collecting and making use of data from independent systems is a common problem.

In this example, the homeowner was able to quickly construct a consolidated dashboard while providing a foundation for more sophisticated management of the different systems in the building.

The Vesta open source tools also allowed him to easily integrate unique devices not anticipated by the manufacturer.